The U.S. equities markets have taken a beating recently.
Nearly every stock has gone down, including big U.S. oil companies.
These are the kind of low Beta and good dividend stocks that a
conservative investor will buy in troubled times. The continuing long
term uptrend in oil is a well known secular growth story. China is now
the largest new car auto market. It seems almost inevitable that it will
soon be the biggest oil consumer, and it is far from the only emerging
market oil demand increase story. China has 1.34B people.It uses 8.2 million bopd.
This is about 2.23 barrels of oil per person per year. By contrast the
U.S. has a population of approximately 0.31B, but it uses 18.69 million
bopd. This is about 21.86 barrels of oil per person per year. The
comparison to India is even worse. It uses only 0.89 barrels of oil per
person per year. It is easy to see that the world demand for oil will go
up dramatically as the emerging economies emerge. China is already the
world’s second largest economy. If China and India start using closer to
5 barrels of oil per person per year, their current oil demand will
grow from 11.18 bopd to approximately 34.35 million barrels of oil per
day. These two countries use of less than 25% of the U.S. usage per
person would increase world oil demand by over 23 million bopd. The
above is without even considering the rest of the world’s emerging
market economies (of which there are 43 more in Asia alone). Everyone
wants more oil -- as cheaply as possible. Longer term the price of oil
will go up, even if it falls a bit in the near term. This last is by no
means certain. Oil demand is already near peak oil, and speculation
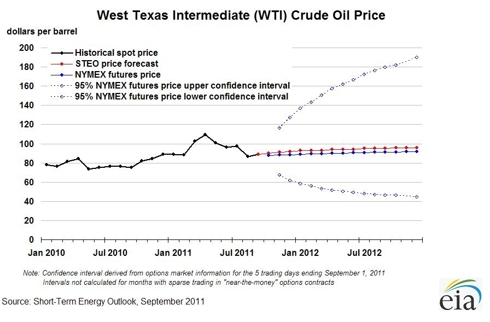
seems to more than make up for any lack. The most recent EIA short term
outlook is below (2011-2012).
(Click to enlarge)
Some of the big U.S. oil companies that one might consider are: Chevron Corp. (CVX), Exxon Mobil Corp. (XOM), Conoco Phillips (COP), Marathon Oil Corp. (MRO), and Occidental Petroleum Corp. (OXY). Not only do these companies have huge production already, but they are participating in many of the most prolific new fields, even the oil shale fields. When these companies are beaten down as they are now, they provide opportunity for good long term growth as well as good dividend returns. The analysts’ current projected one year stock price growth for each of these stocks is: CVX = 31%, XOM = 27%, COP = 26%, MRO = 58%, and OXY = 55%.
These companies provide true stability. CVX produced 2.763 million net boepd in 2010, aside from its myriads other businesses. XOM produced 4.45 million boepd in 2010. This was up 13% from the previous year. The other companies productions are similarly robust, although smaller for MRO and OXY as they are smaller companies. All of these companies have truly fantastic oil fields that have yet to be developed. These assets often do not show up in the proved or probable reserves. MRO should also benefit from getting its Libyan assets back. Some repair work will be necessary. However, the former production should go back online within 12-18 months. This amounts to approximately 50,000 boepd of production. This will be a significant addition to MRO’s approximately 390,000 boepd of production in 2010.
The fundamental financial data for all of these companies is good to great. If you invest long term in these stocks at the prices they are at now, you will almost certainly make money. Perhaps you will make great money. The data is in the table below. The data is from TDameritrade and Yahoo Finance.
From
the above data, I would probably rule out MRO as a near term
investment. Its FY2012 estimate has fallen too far in the last 90 days.
The FY2012 EPS estimate for OXY may have been revised downward
substantially in the last 90 days, but it did beat last quarter. Plus it
has the highest 5 year EPS Growth Estimate per annum of 12.00%. Further
it is sitting on some fantastic oil shale properties that should pay
huge benefits in the next few years. As a long term investment this is a
good one. CVX and XOM are both strong stocks. However, XOM missed on
earnings last quarter. Plus its FY2012 estimates have gone down a lot in
the last 90 days. I would prefer CVX over XOM at this time, although I
would have to say that XOM does seem to be growing its reserves faster
than CVX. In the longer term, it may well perform better. In the shorter
term, I expect CVX will do better. COP is another strong stock, but it
seems to be suffering from some of the break up ills of MRO. COP (about
to split) and MRO split off their refinery businesses recently. I would
tend to wait until the problems associated with the splits resolve
themselves.
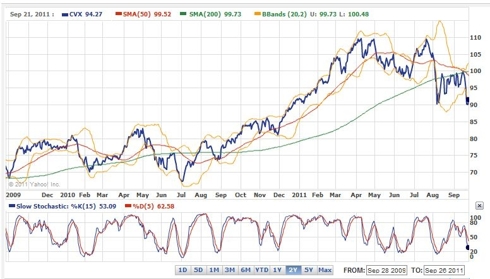
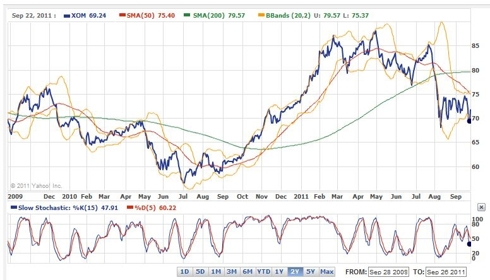
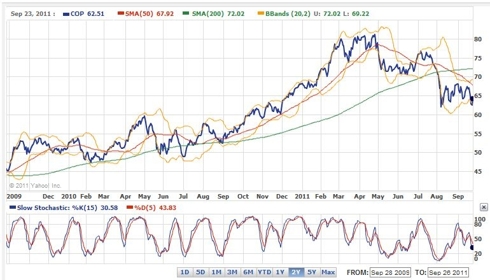
Let’s look at the 2 year charts of these stocks to get some technical direction for one or more trades.
The two year chart of CVX is below:
(Click to enlarge)
The two year chart of XOM is below:
(Click to enlarge)
The two year chart of COP is below:
(Click to enlarge)
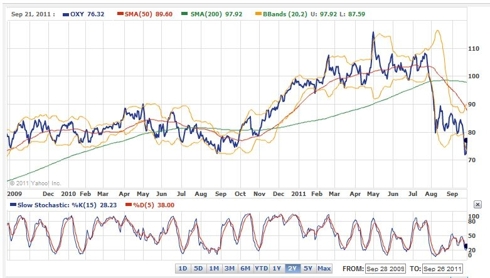
The two year chart of OXY is below:
(Click to enlarge)
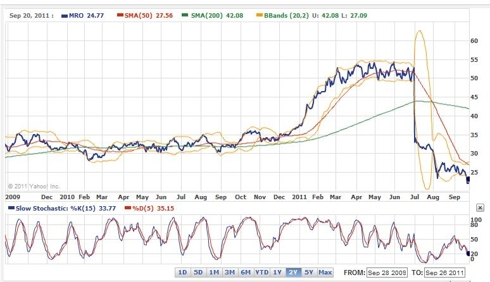
The two year chart of MRO is below:
(Click to enlarge)
The Slow Stochastic sub charts of each of the above stocks show they are all at or near oversold levels. The chart of MRO is too weak to be sure of it changing its performance noticeably. The chart likely reflects the split off of the refinery business. Still MRO has not performed well since then. It is likely a good idea to wait on this stock. COP looks like a strong stock that has shown weakness as the overall market has fallen. However, it is unclear what will happen when the company likely eventually splits into two. Of the remaining three stocks, CVX has the strongest chart. OXY with its predicted 55% one year price appreciation is attractive. Ditto XOM, although the price appreciation predicted is much less. It is nice to be able to pick and choose among great companies.
Good Luck trading.
Disclosure: I have no positions in any stocks mentioned, but may initiate a long position in CVX, OXY over the next 72 hours.

(Click to enlarge)
Some of the big U.S. oil companies that one might consider are: Chevron Corp. (CVX), Exxon Mobil Corp. (XOM), Conoco Phillips (COP), Marathon Oil Corp. (MRO), and Occidental Petroleum Corp. (OXY). Not only do these companies have huge production already, but they are participating in many of the most prolific new fields, even the oil shale fields. When these companies are beaten down as they are now, they provide opportunity for good long term growth as well as good dividend returns. The analysts’ current projected one year stock price growth for each of these stocks is: CVX = 31%, XOM = 27%, COP = 26%, MRO = 58%, and OXY = 55%.
These companies provide true stability. CVX produced 2.763 million net boepd in 2010, aside from its myriads other businesses. XOM produced 4.45 million boepd in 2010. This was up 13% from the previous year. The other companies productions are similarly robust, although smaller for MRO and OXY as they are smaller companies. All of these companies have truly fantastic oil fields that have yet to be developed. These assets often do not show up in the proved or probable reserves. MRO should also benefit from getting its Libyan assets back. Some repair work will be necessary. However, the former production should go back online within 12-18 months. This amounts to approximately 50,000 boepd of production. This will be a significant addition to MRO’s approximately 390,000 boepd of production in 2010.
The fundamental financial data for all of these companies is good to great. If you invest long term in these stocks at the prices they are at now, you will almost certainly make money. Perhaps you will make great money. The data is in the table below. The data is from TDameritrade and Yahoo Finance.
| Stock | CVX | XOM | COP | OXY | MRO |
| Price | $91.49 | $71.72 | $64.13 | $76.99 | $23.23 |
| 1 yr Analysts’ Target price | $120.35 | $91.09 | $80.67 | $118.95 | $36.67 |
| Predicted % Gain | 31% | 27% | 26% | 55% | 58% |
| PE | 7.99 | 9.45 | 8.09 | 10.87 | 4.88 |
| FPE | 6.90 | 8.07 | 7.25 | 8.39 | 5.94 |
| Avg. Analysts’ Opinion | 1.8 | 2.2 | 2.5 | 2.0 | 2.3 |
| Miss Or Beat Amount For Last Quarter | +$0.28 | -$0.15 | +$0.22 | +$0.07 | -$0.04 |
| FY2012 EPS Estimate | $13.26 | $8.89 | $8.84 | $9.18 | $3.91 |
| FY2012 EPS Estimate 90 days ago | $12.86 | $9.07 | $8.82 | $9.82 | $6.19 |
| EPS % Growth Estimate for 2011 | 44.40% | 38.40% | 40.70% | 43.20% | -1.60% |
| EPS % Growth Estimate for 2012 | -2.00% | 3.30% | 6.10% | 12.10% | 8.90% |
| 5 yr. EPS Growth Estimate per annum | 4.50% | 6.47% | -0.20% | 12.00% | 6.78% |
| Market Cap | $182.25B | $348.71B | $88.05B | $62.58B | $16.59B |
| Enterprise Value | $176.81B | $355.16B | $107.77B | $64.83B | $16.68B |
| Beta | 0.73 | 0.45 | 1.23 | 1.03 | 1.23 |
| Total Cash per share (mrq) | $8.97 | $2.07 | $5.93 | $2.45 | $6.91 |
| Price/Book | 1.58 | 2.24 | 1.29 | 1.78 | 0.99 |
| Price/Cash Flow | 5.04 | 6.38 | 4.36 | 7.37 | 2.97 |
| Short Interest as a % of Float | 1.72% | 1.12% | 1.96% | 1.29% | 2.04% |
| Total Debt/Total Capital (mrq) | 9.00% | 9.25% | 24.74% | 10.78% | 23.11% |
| Quick Ratio (mrq) | 1.33 | 0.71 | 0.94 | 1.08 | 1.68 |
| Interest Coverage (mrq) | -- | 414.76 | 27.92 | 106.52 | 71.38 |
| Return on Equity (ttm) | 21.38% | 25.65% | 17.02% | 17.11% | 12.59% |
| EPS Growth (mrq) | 42.73% | 36.01% | -13.14% | 68.88% | -20.88% |
| EPS Growth (ttm) | 36.12% | 46.80% | 32.23% | 39.65% | -- |
| Revenue Growth (mrq) | 30.08% | 35.68% | 33.58% | 33.88% | 33.14% |
| Revenue Growth (ttm) | 18.60% | 23.99% | 26.05% | 19.88% | 67.50% |
| Annual Dividend Rate | $3.12 (3.50%) | $1.88 (2.70%) | $2.64 (4.20%) | $1.84 (2.50%) | $0.60 (2.70%) |
| Gross Profit Margin (ttm) | 32.03% | 28.59% | 14.35% | $70.28% | 17.55% |
| Operating Profit Margin (ttm) | 17.15% | 14.94% | 9.45% | $41.70 | 8.64% |
| Net Profit Margin (ttm) | 9.92% | 8.84% | 5.08% | $24.86 | 4.03% |
Let’s look at the 2 year charts of these stocks to get some technical direction for one or more trades.
The two year chart of CVX is below:

(Click to enlarge)
The two year chart of XOM is below:

(Click to enlarge)
The two year chart of COP is below:

(Click to enlarge)
The two year chart of OXY is below:

(Click to enlarge)
The two year chart of MRO is below:

(Click to enlarge)
The Slow Stochastic sub charts of each of the above stocks show they are all at or near oversold levels. The chart of MRO is too weak to be sure of it changing its performance noticeably. The chart likely reflects the split off of the refinery business. Still MRO has not performed well since then. It is likely a good idea to wait on this stock. COP looks like a strong stock that has shown weakness as the overall market has fallen. However, it is unclear what will happen when the company likely eventually splits into two. Of the remaining three stocks, CVX has the strongest chart. OXY with its predicted 55% one year price appreciation is attractive. Ditto XOM, although the price appreciation predicted is much less. It is nice to be able to pick and choose among great companies.
Good Luck trading.
Disclosure: I have no positions in any stocks mentioned, but may initiate a long position in CVX, OXY over the next 72 hours.
This article is tagged with: Investing for Income, Dividend Quick Picks & Lists, Basic Materials, United States
You may also like
-
Print
Comments (0)
Be the first to comment on this article
Add a comment
Free Registration:
Register below and get the most out of Seeking Alpha
Register below and get the most out of Seeking Alpha
Already a member? Sign in here


